
Product Metrics Hierarchy
“A structured framework organising metrics from high-level outcomes through mid-level drivers to operational measures.”
Executives watch one number. Your team watches another. Nobody's checked whether they're connected.
Product Metrics Hierarchy is a structured framework for organising metrics from high-level outcomes through mid-level drivers to operational measures. You build a tree that shows how daily metrics connect to strategic goals, then test whether the causal links actually hold.
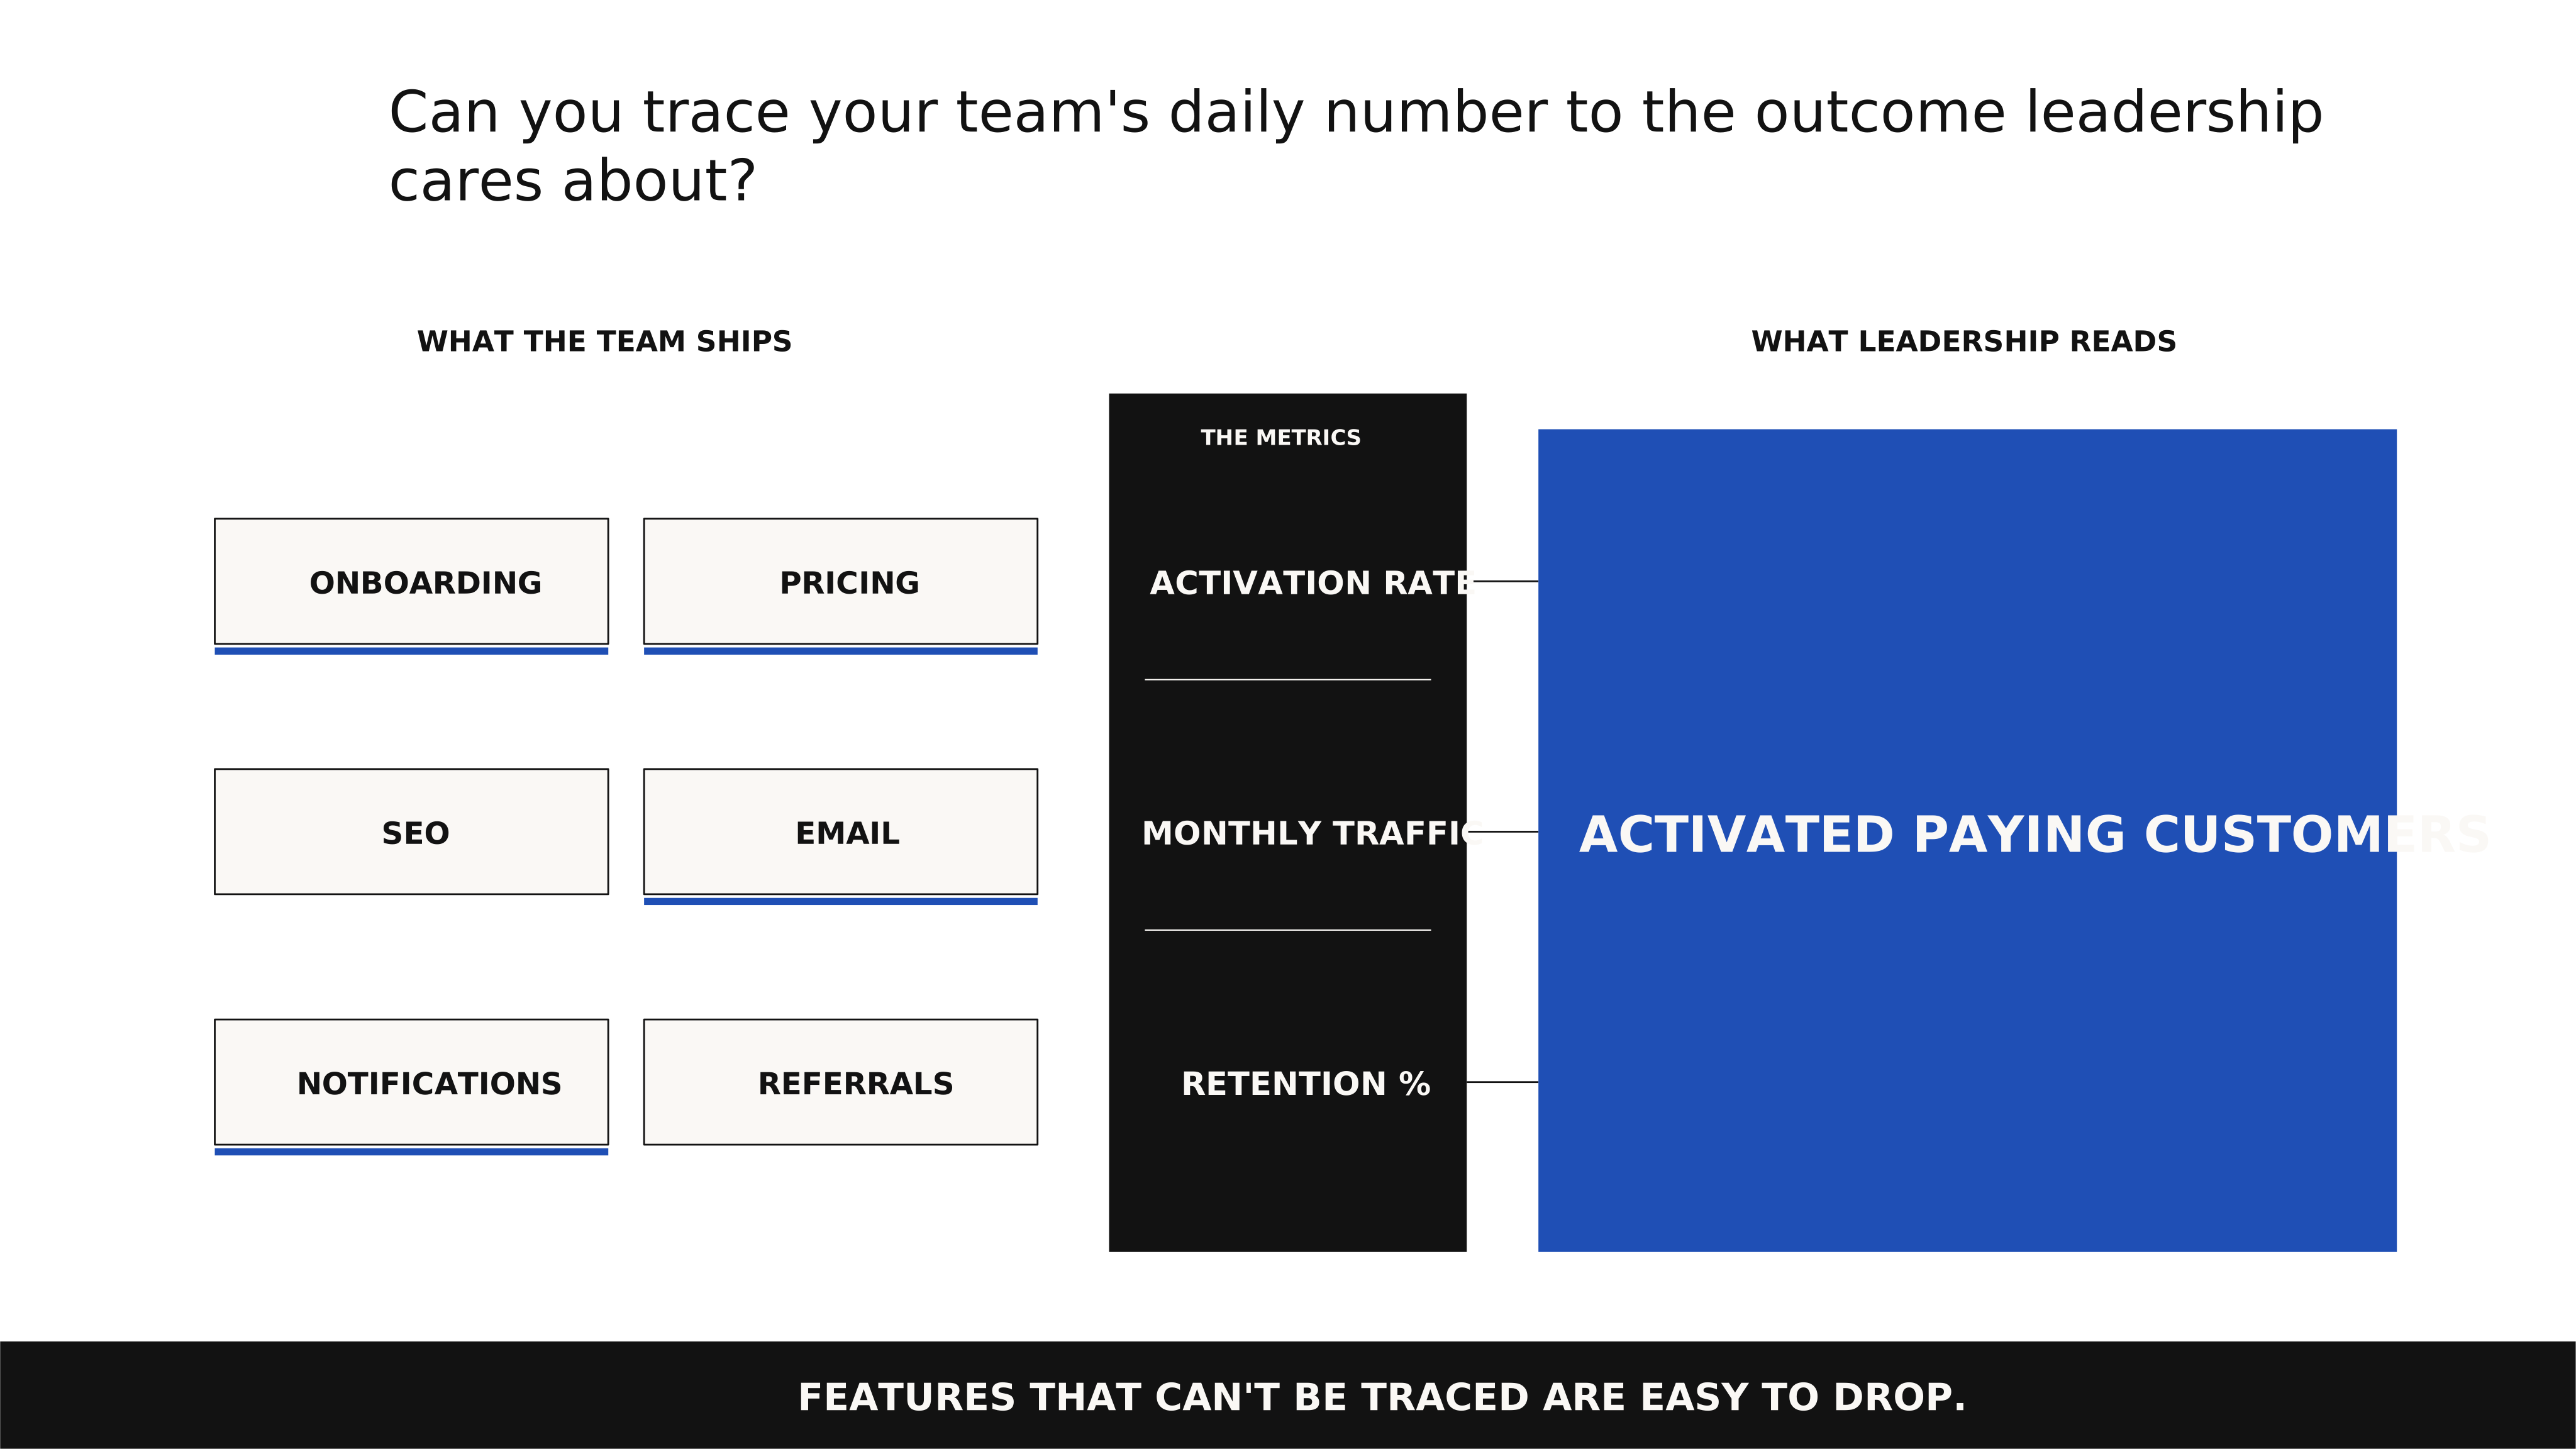
The hierarchy prevents two common traps: vanity metrics that look impressive but mean nothing, and metric fragmentation where teams track so many numbers that none of them drive decisions. Effective hierarchies distinguish leading indicators from lagging ones and ensure causality flows logically between levels — not just correlation, but genuine cause.
Without this structure, executives optimise the top-line metric that hides everything, and teams optimise the operational metric that misses the point. The technique fails when the hierarchy becomes rigid doctrine rather than a living model.
Products and markets evolve; the connections between metrics shift. Regular review keeps the links honest. It also needs cross-team alignment — a hierarchy that only one team believes in creates the illusion of coherence.
Your next move: Trace the metric your team optimises daily up to the outcome leadership cares about — and if the line breaks somewhere in the middle, why is anyone still chasing the bottom one?
What it looked like for them
Quibi, April–December 2020. Quibi launched with $1.75 billion in funding, Hollywood-grade content, and a metric at the top of the hierarchy that said "success": the launch itself. Beneath that headline number, the product metrics told a different story. No screenshots.
No casting to television. No social sharing. Every metric that measured whether users could spread the content — the layer of the hierarchy that determines whether a content product grows — was structurally capped at zero by design choices made to protect intellectual property.
The hierarchy of metrics had been built with content protection at the top and user behaviour underneath. A product metrics hierarchy built the other way — user behaviour at the top, content protection as a constraint rather than a goal — would have surfaced the tension before $1.75 billion was spent resolving it.
Quibi blamed COVID. The real failure was a metrics hierarchy that measured what the company wanted to protect rather than what users wanted to do.
“The dashboard says we're fine but I don't believe it.”