
Performance Monitoring
“Technical practices for observing application behaviour, system health, and operational metrics.”
Something's slow in production. Users have noticed. Your team hasn't — or they have, and the alert fired so often they stopped looking.
Performance monitoring is the practice of observing application behaviour, system health, and operational metrics in production environments. You instrument your systems, set thresholds, and create alerts that surface genuine problems before users are significantly affected.
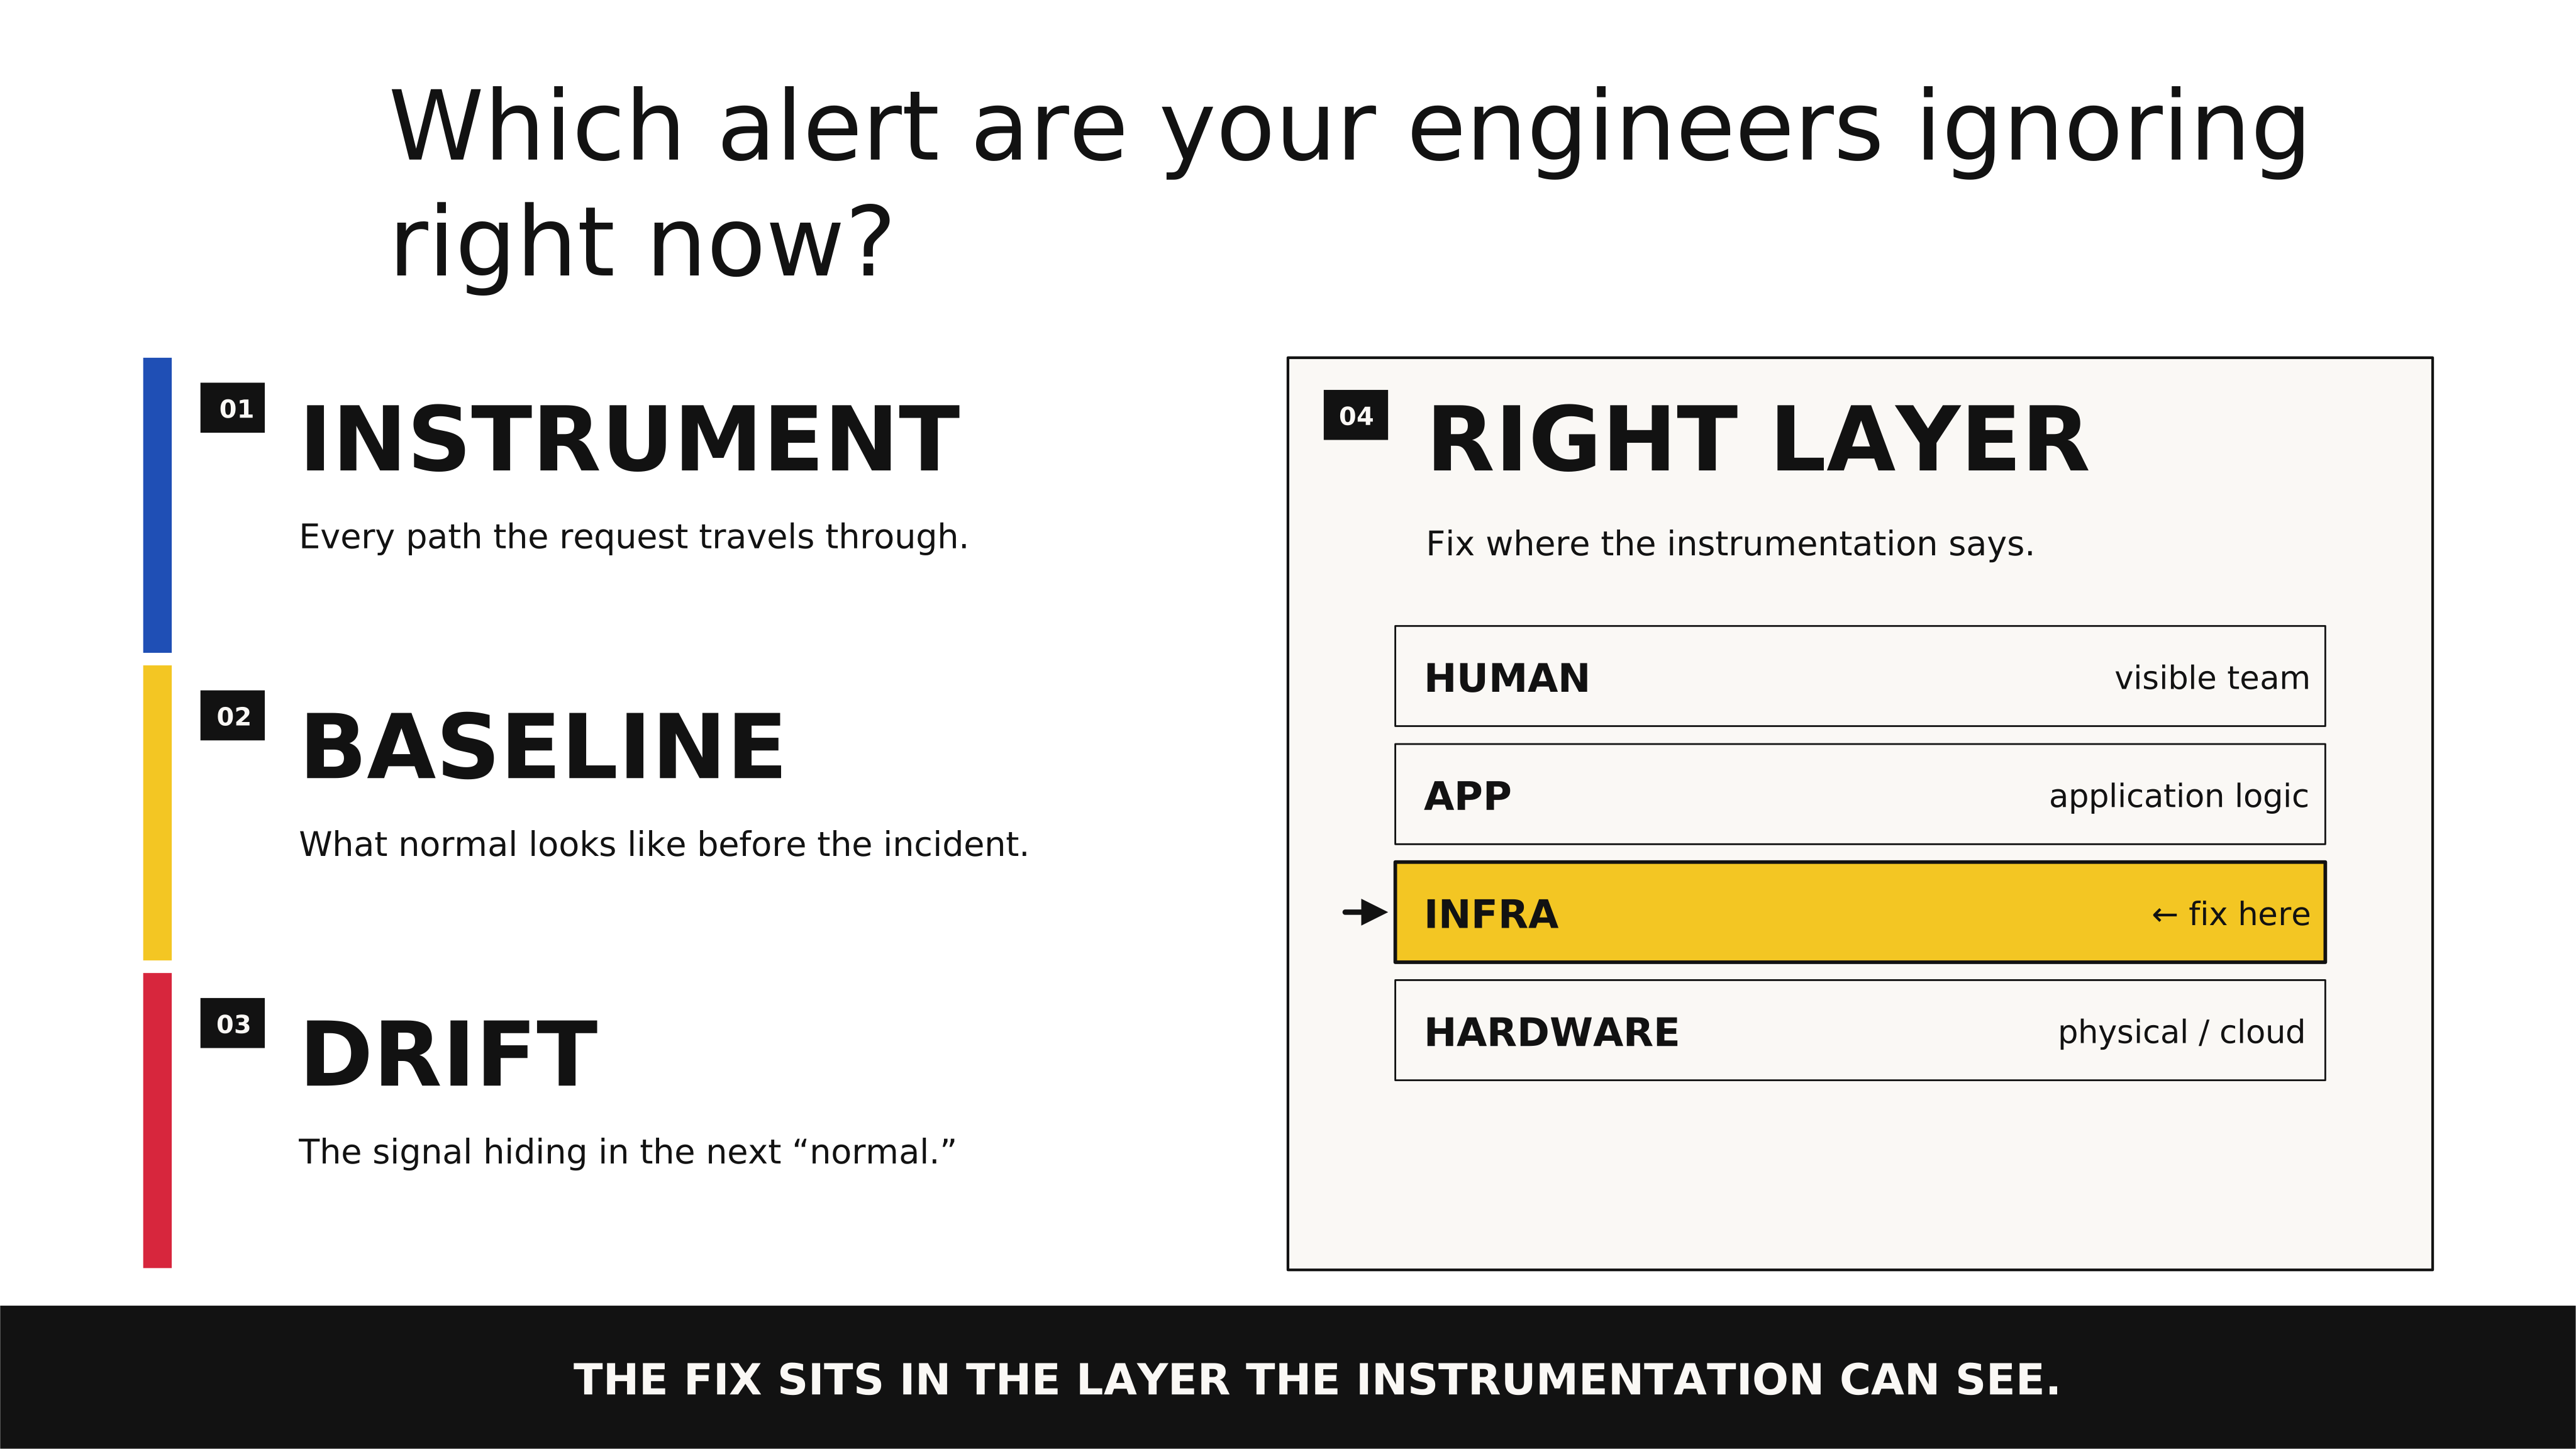
The goal is reducing two numbers: mean time to detection and mean time to resolution. Application Performance Monitoring (APM) tools provide visibility into response times, error rates, throughput, and resource utilisation. As systems become more distributed, observability — understanding internal state from external outputs — becomes essential.
The discipline involves deciding what to monitor, setting thresholds that distinguish signal from noise, and creating alerts that are actionable. The failure mode is alert fatigue: too many notifications, too many false positives, until the team treats every alert as background noise and the real incident hides inside the next "normal" one. Monitoring data also supports longer-term capacity planning, but only if someone's actually reviewing it.
Your next move: Which alert do your engineers now ignore because it fires too often to be useful — and what failure is hiding inside the next 'normal' instance of it?
What it looked like for them
Boeing, 737 MAX, 2010s. Boeing's performance monitoring systems were extensive. Every aircraft programme had dashboards, review cadences, and escalation paths. The monitoring was working — in the sense that it was collecting data and producing reports.
What it wasn't doing was surfacing the signals that mattered. The MCAS flight control system's dependency on a single angle-of-attack sensor was visible in the engineering data. The gap between what the system needed to be safe and what it actually was could have been measured.
But the monitoring architecture routed performance data through the same management structure that was incentivised to keep the programme on schedule. Signals that threatened the timeline were absorbed before they reached anyone with the authority to act.
Two crashes and 346 deaths later, the investigation found that the performance data to prevent the disaster had been inside the system the whole time. Performance monitoring that routes truth through a structure that rewards silence isn't monitoring. It's documentation of a failure that hasn't happened yet.
“The dashboard says we're fine but I don't believe it.”