
Analytics and Data Analysis
“The systematic examination of quantitative data to understand user behaviour, product performance, and business outcomes.”
You have more data than ever. Dashboards everywhere. Decisions haven't got any better.
Analytics and data analysis is the practice of examining quantitative data to understand user behaviour, product performance, and business outcomes. You instrument, collect, and interpret — then act on what you find.
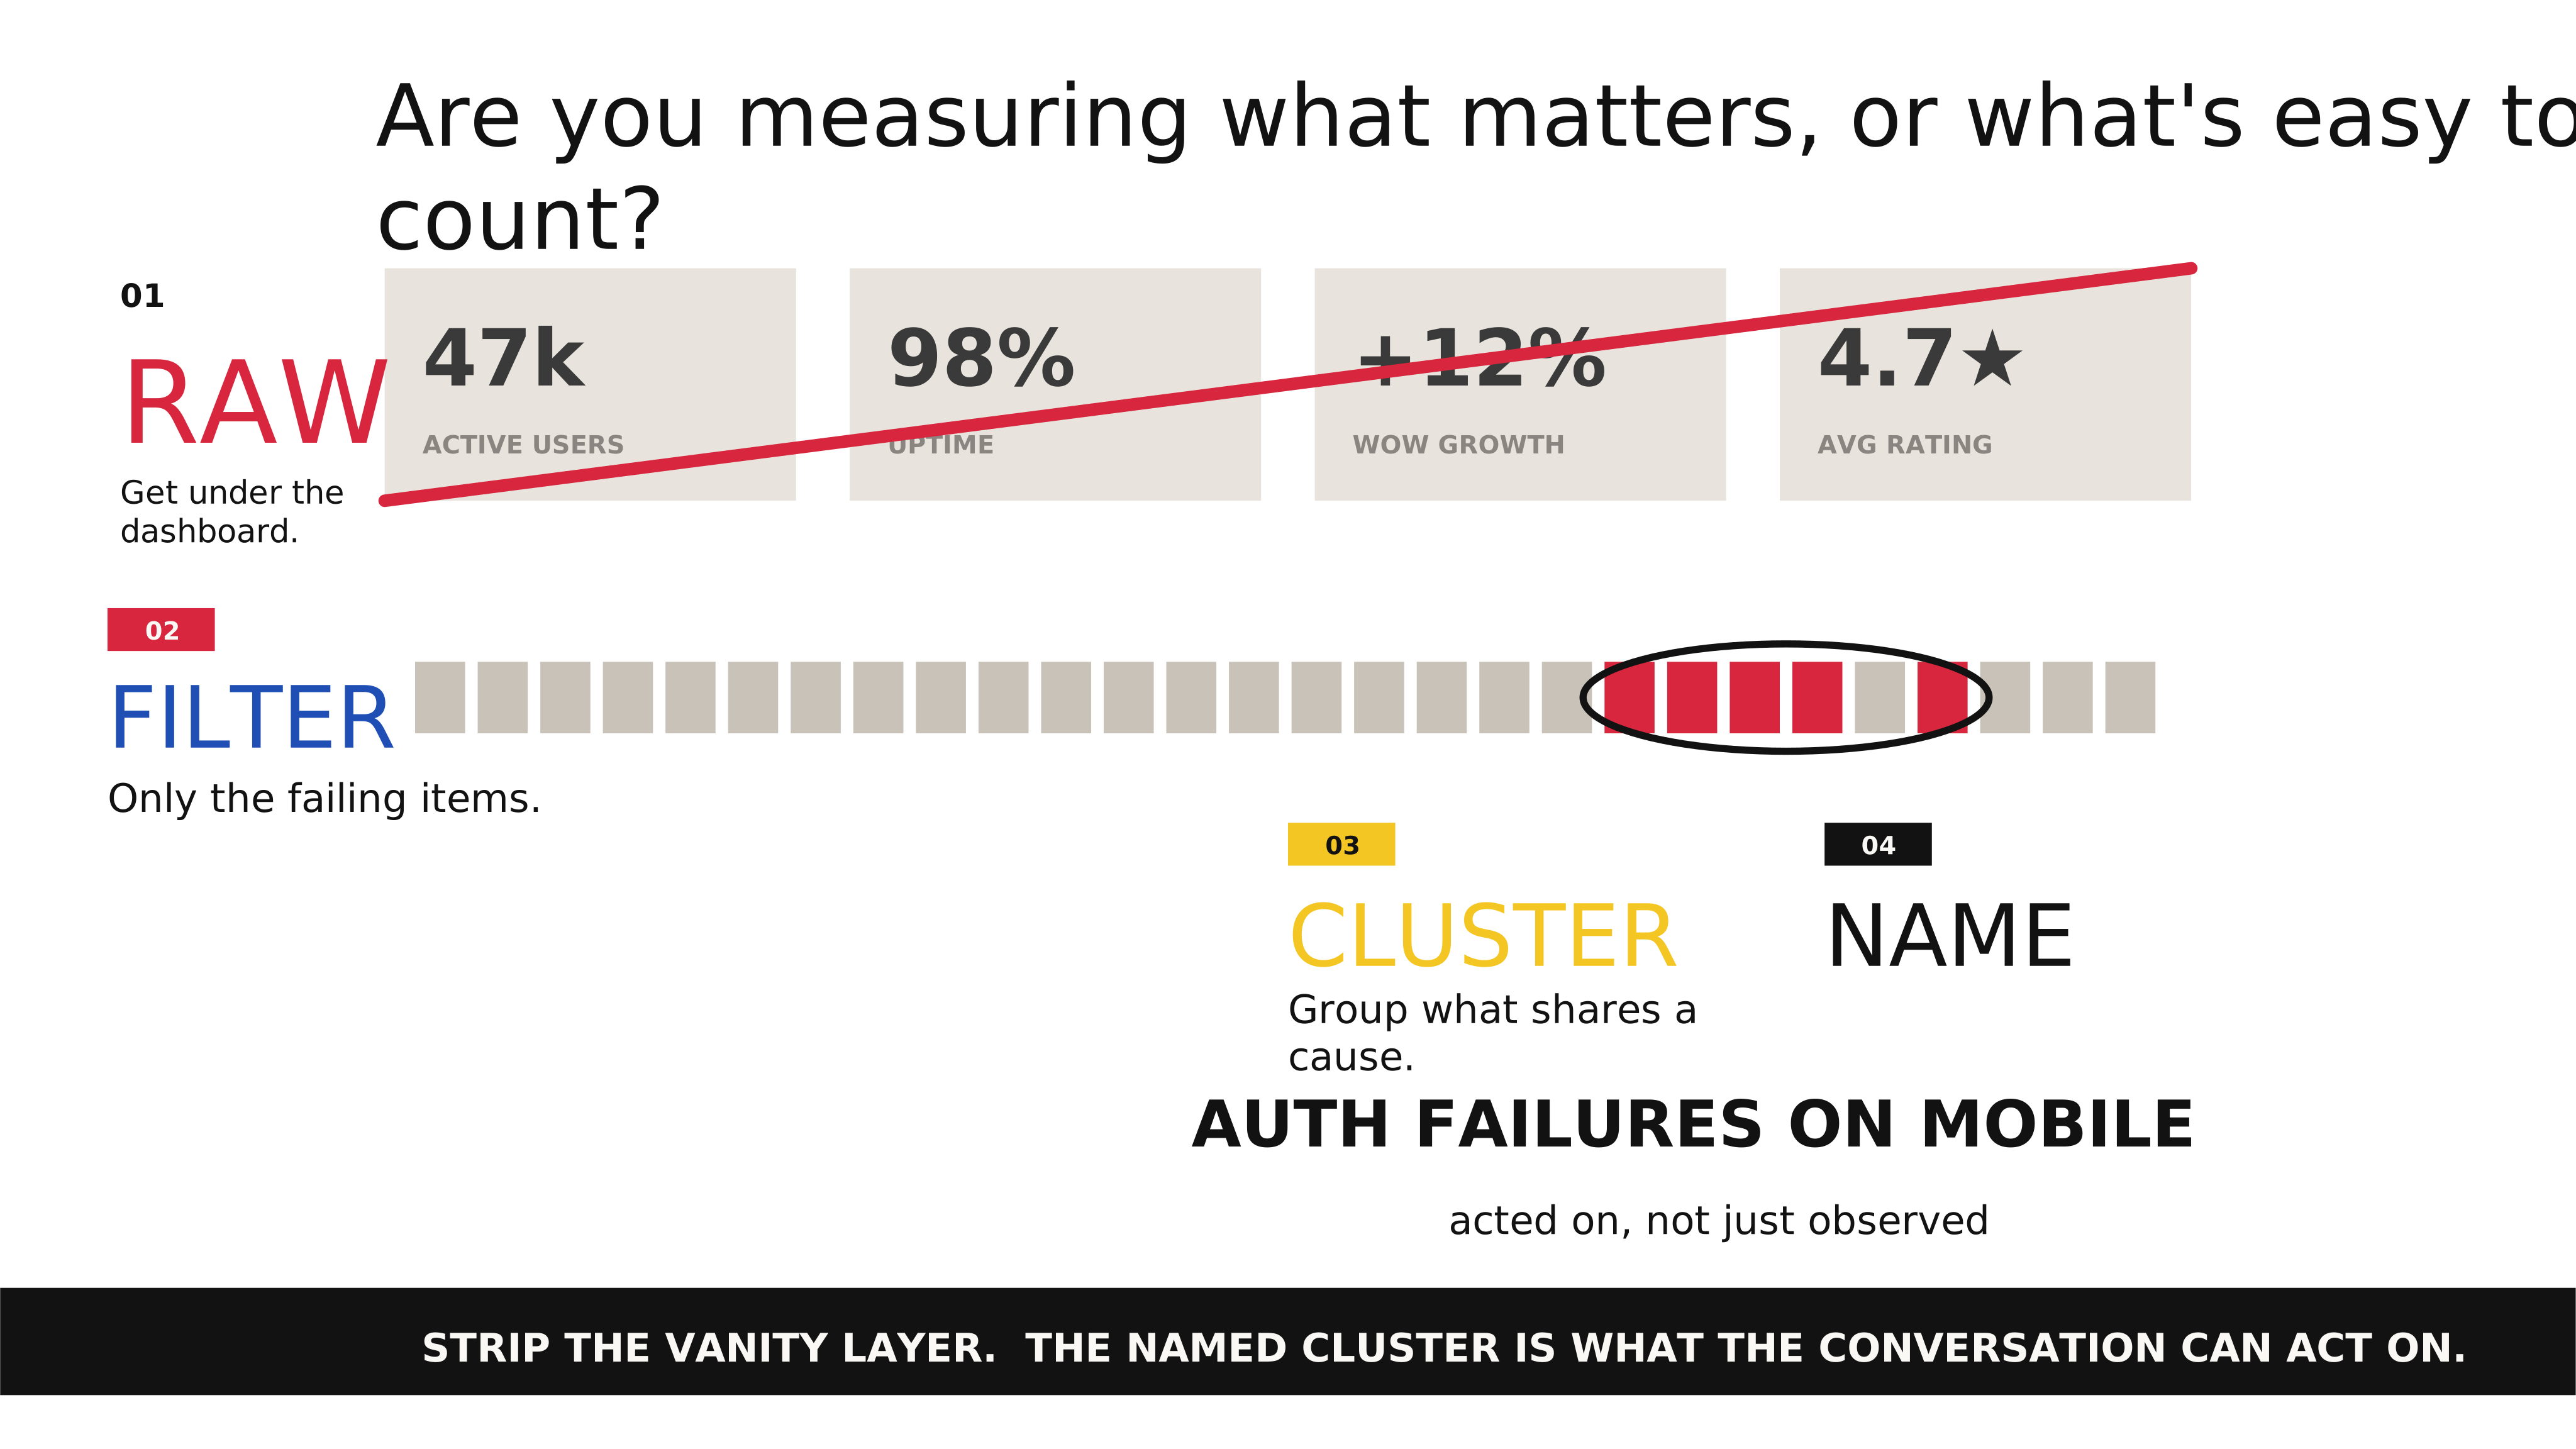
The challenge isn't collection; modern platforms capture more signals than anyone can review. The challenge is asking the right questions and distinguishing vanity metrics — impressive-looking numbers that drive no decisions — from actionable metrics that change what you do next. Data analysis proves most valuable when paired with qualitative research that explains the why behind the numbers.
Without that context, teams end up optimising metrics that don't correlate with user value or business success. The other trap is analysis paralysis: the belief that one more chart will produce the insight that makes the decision obvious. It won't. Data supports decisions; it doesn't make them.
Your next move: Which chart on your dashboard does everyone look at and nobody acts on — and what would happen if you deleted it next Monday?
What it looked like for them
Boeing, 737 MAX, 2010s. Boeing restructured so that engineers reported to business-unit heads rather than chief project engineers. The effect on data analysis was structural: production deadlines took priority over quality signals.
The MCAS flight control system relied on a single angle-of-attack sensor — a design that data analysis should have flagged as a single point of failure. Engineers who raised concerns either didn't escalate them or had them absorbed without reaching decision-makers.
The reporting structure made it costly to tell the truth upward, filtering out the information that would have changed the design. Two crashes killed 346 people. The fleet was grounded for over a year. The data that would have prevented the disaster existed inside the organisation.
It wasn't analysed, wasn't escalated, and wasn't acted on — not because the analysis was difficult, but because the structure made the analysis expensive for the person doing it. Analytics fails when the environment punishes the analyst for what the analysis reveals.
“The dashboard says we're fine but I don't believe it.”